Have you ever wondered why some values can include decimals while others are counted in whole numbers? The difference between continuous or discrete data helps explain this everyday concept in mathematics, statistics, science, and technology. Although the terms may sound complicated at first, their meanings become much easier to understand with practical examples. For instance, a person’s height can be measured as 170.5 centimeters, while the number of books on a shelf is counted as 10, 11, or 12. Understanding this distinction helps you interpret information accurately and avoid mistakes when working with numbers, measurements, and data.
The main difference is that continuous data can take any value within a meaningful range, including decimal values, whereas discrete data consists of distinct, countable values. Temperature, weight, distance, and time are common examples of continuous variables. In contrast, the number of students in a classroom, cars in a parking lot, or messages in an inbox represents discrete data. These categories are especially important in statistical analysis because the type of variable influences how information is collected, displayed, and interpreted.
In this guide, you will explore the definitions of continuous and discrete data, compare their characteristics, and learn how to recognize each type through clear examples. The explanations follow standard mathematical and statistical principles, making the topic accessible to students, researchers, professionals, and curious learners. You will also discover common classification mistakes and practical rules for choosing the correct category. By the end, you will have a stronger understanding of continuous versus discrete variables and be better prepared to apply these concepts in academic assignments, data analysis, and real world situations.
Continuous vs Discrete: What’s the Difference?
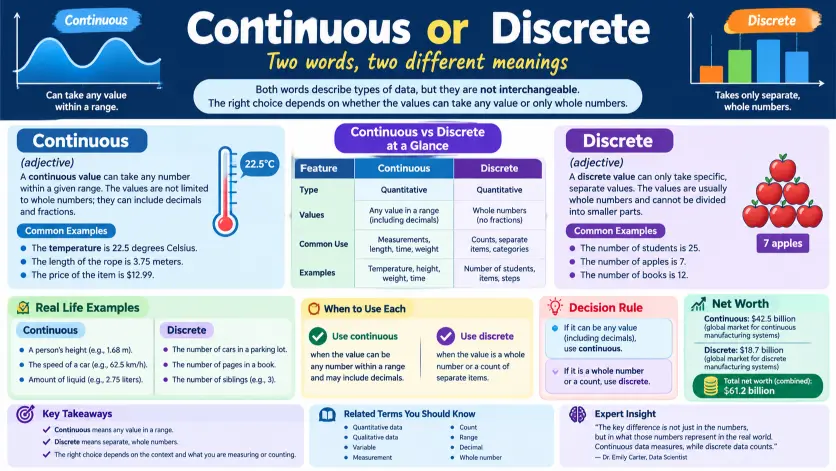
Continuous and discrete are adjectives that describe two different types of values, quantities, or data. Although both concepts help explain how information is represented, they aren’t interchangeable. The essential distinction is whether values can vary smoothly within an interval or occur as separate, distinguishable possibilities.
For example, a person’s height is generally treated as continuous because it can be measured to increasingly precise decimal places. By contrast, the number of books on a shelf is discrete because books are counted in whole units.
Consequently, understanding this difference helps students, researchers, analysts, and professionals select appropriate measurement methods, statistical techniques, and visual representations.
Definitions and Parts of Speech
Continuous (adjective): Continuous describes something that extends without interruption or varies smoothly across a range. In mathematics and statistics, a continuous variable can take any value within a specified interval, subject to the precision of the measurement system.
Examples include temperature, distance, elapsed time, and height when modeled as continuous quantities.
Discrete (adjective): Discrete describes separate, distinct, or individually distinguishable items or values. In mathematics and statistics, a discrete variable takes values from a finite or countably infinite set. Such values often represent counts, including the number of customers, books, or website visits.
Examples include the number of students in a classroom, the number of cars in a parking lot, and the number of messages received.
Comparison Table
| Feature | Continuous | Discrete |
|---|---|---|
| Basic meaning | Varies smoothly across a range | Consists of distinct values |
| Typical data | Measurements | Counts |
| Possible values | Any value within a modeled interval | Values from a finite or countable set |
| Decimal values | Often possible | Depend on the variable’s definition |
| Examples | Height, temperature, duration | People, books, goals |
| Common graph | Line graph or histogram | Bar chart or count distribution |
| Statistical model | Continuous probability distribution | Discrete probability distribution |
| Measurement approach | Measuring instruments | Counting or recording categories |
Quick Recap
Continuous quantities can take intermediate values within a specified range.
Discrete quantities consist of distinct values that can be counted or listed.
Height and temperature are common continuous examples.
The number of people in a room is a typical discrete example.
Therefore, identify whether the quantity represents a measurement or a count before deciding which category applies.
Is Continuous vs Discrete a Grammar, Vocabulary, or Usage Issue?
The distinction between continuous and discrete is primarily a conceptual and vocabulary issue, rather than a grammar problem. Both words are grammatically correct adjectives, but they describe different mathematical and scientific properties.
In everyday English, continuous can mean uninterrupted, while discrete generally means separate or distinct. In technical subjects, however, their meanings become more precise, particularly when discussing variables, probability distributions, signals, and data analysis.
Are Continuous and Discrete Interchangeable?
No. Although both words describe characteristics of things, they refer to different properties.
For instance, a continuous variable might represent the amount of rainfall measured during a particular period. The measurement could be 12.4 millimeters, 12.45 millimeters, or another value within the instrument’s resolution.
Conversely, the number of rainy days recorded in a month is discrete because the count takes whole number values.
Nevertheless, the distinction depends on what is being measured. The duration of a rainfall event can be modeled as continuous, while the number of rainfall events is discrete.
Formal and Informal Usage
In casual conversation, continuous often describes an activity that continues without stopping. For example, someone might experience continuous noise from nearby construction.
Discrete can describe separate objects or individual stages. A teacher might divide a lesson into discrete activities.
In formal writing, both terms require greater precision. Researchers should identify the variable being studied, its possible values, and the assumptions behind the selected model.
Academic and Everyday Contexts
In mathematics, continuous and discrete functions have different properties. A continuous function has no breaks in its graph over the relevant domain, while a discrete function may be defined only at separate input values.
In statistics, the distinction influences probability calculations. Continuous random variables are described using probability density functions, whereas discrete random variables use probability mass functions.
Meanwhile, computer science distinguishes continuous signals from discrete representations. A computer commonly processes numerical samples rather than every possible value of an original physical signal.
Therefore, the context determines how these terms should be interpreted.
Practical Usage: When to Use Continuous
Use continuous when describing a quantity, process, signal, or function that can vary smoothly within a range or continue without interruption. However, the precise meaning depends on the subject.
1. Workplace Examples
In manufacturing, continuous measurements help monitor production quality.
Example: “The quality control team continuously monitored the temperature of the production equipment.”
Here, temperature is a continuous quantity, while the monitoring process occurs repeatedly over time.
Similarly, in operations management, continuous improvement describes an ongoing effort to improve processes.
Example: “The company introduced a continuous improvement program to reduce production waste.”
In this second example, continuous describes an ongoing process rather than a statistical variable.
2. Academic Examples
In physics, distance, elapsed time, and temperature are commonly modeled as continuous quantities.
Example: “The researcher measured the continuous variation in temperature throughout the experiment.”
In statistics, a continuous random variable can take any value within a specified interval.
Example: “The analysis treated adult height as a continuous variable.”
Although actual measuring devices have limited precision, the continuous model remains useful when intermediate values are meaningful.
3. Technology Examples
In electronics, a continuous signal can vary over time without being restricted to a predetermined set of amplitude values.
Example: “The sensor produced a continuous voltage signal as the pressure changed.”
Similarly, software systems may record continuous measurements such as elapsed time, temperature, or distance.
However, computers generally store finite digital representations. As a result, the underlying physical quantity can be continuous even when its recorded measurements are discrete samples.
Usage Recap
Choose continuous when describing smooth variation, uninterrupted activity, or quantities modeled across a range. Additionally, identify whether you’re discussing the quantity itself, the recording process, or a mathematical function.
Practical Usage: When to Use Discrete
Use discrete when referring to distinct items, countable quantities, separate values, or a system that operates using individually distinguishable states. In mathematics and data analysis, the word commonly describes variables that take values from a finite or countably infinite set.
1. Workplace Examples
In retail, discrete quantities include the number of products sold, orders received, and customers served.
Example: “The manager recorded the discrete number of defective items in each shipment.”
Since individual items are counted, the resulting total is a whole number.
Likewise, a project manager might divide a large assignment into separate stages.
Example: “The team organized the project into discrete tasks with clearly defined responsibilities.”
Here, discrete means distinct or separate rather than statistically countable.
2. Academic Examples
In statistics, a discrete random variable often represents a count.
Example: “The researcher modeled the number of children in each household as a discrete variable.”
The possible values are zero, one, two, three, and so on.
In mathematics, a function may also be defined only at selected input values.
Example: “The exercise examined a discrete function defined at integer inputs.”
Consequently, the relevant values don’t fill every point along an interval.
3. Technology Examples
Digital systems frequently process discrete states or numerical values.
Example: “The controller used discrete states to represent whether the machine was on or off.”
In computing, binary systems represent information through distinguishable states, commonly encoded as zeros and ones.
Similarly, a monitoring application might count how many times a device sends an alert.
Example: “The dashboard displayed the discrete number of alerts generated each hour.”
Usage Recap
Choose discrete when the subject involves separate values, countable items, or distinct states. Nevertheless, check whether the word refers to mathematical data or simply means separate in ordinary language.
When You Should NOT Use Continuous or Discrete
Several common errors occur when writers classify data according to appearance rather than the nature of the quantity.
- Don’t automatically classify every decimal as continuous. A count of money in cents may be discrete when the smallest permitted unit is one cent.
- Don’t assume every whole number represents discrete data. A continuous measurement can be rounded to the nearest whole number before recording.
- Don’t describe the number of students as continuous. People are counted individually, so the total is discrete.
- Don’t assume every measurement is perfectly continuous in a computer. Digital devices store finite representations, even when the underlying physical quantity is continuous.
- Don’t confuse continuous observation with continuous data. A sensor can collect observations every second while recording a continuous physical quantity through discrete samples.
- Don’t treat discrete as a synonym for discontinuous in every context. Discrete means distinct or separate, whereas discontinuous describes something that contains breaks or interruptions.
- Don’t assume a continuous process must always occur at a constant rate. A continuous quantity can change rapidly, slowly, or irregularly.
- Don’t classify a variable without considering its definition. The number of calls received is discrete, but the total time spent on those calls can be modeled as continuous.
These distinctions are important because incorrect classification may lead to unsuitable statistical models, misleading charts, and inaccurate interpretations.
Common Mistakes and Decision Rules
The following examples demonstrate how to distinguish the two terms in practical writing.
| Correct sentence | Incorrect sentence | Explanation |
|---|---|---|
| Height is commonly modeled as a continuous variable. | Height is always a discrete variable. | Height can be modeled across a range of values. |
| The number of employees is discrete. | The number of employees is continuous. | Employees are counted as individual people. |
| The sensor recorded continuous temperature changes. | The sensor recorded discrete temperature changes when describing a smooth modeled quantity. | The intended model allows intermediate temperatures. |
| The system counted discrete user visits. | The system counted continuous user visits. | Individual visits form a count. |
| The machine produced a continuous signal. | The machine produced a discrete signal when the signal varied smoothly in the stated model. | A continuous signal can vary over a range. |
| The application stored discrete samples of the signal. | The application stored a perfectly continuous digital sequence. | Digital samples are individually represented values. |
| The researcher modeled the number of errors as discrete data. | The researcher modeled the number of errors as continuous data without a justified approximation. | Error counts take distinct whole number values. |
| The experiment measured elapsed time as a continuous quantity. | The experiment treated elapsed time as inherently countable events. | Time is commonly modeled as continuous. |
The Decision Rule
If you mean a quantity that varies smoothly across a range, use continuous.
If you mean separate, countable values, use discrete.
For example, the distance traveled by a vehicle is commonly modeled as continuous, whereas the number of vehicles passing a checkpoint is discrete.
However, remember that mathematical models simplify reality. A physical measurement can be continuous in theory while a digital device records it at separate intervals.
Continuous and Discrete in Modern Technology and Data Systems
Modern technology relies on both continuous quantities and discrete representations. Understanding the distinction helps explain how computers measure the physical world, process information, and generate useful reports.
Sensors and Digital Sampling
Temperature, pressure, and sound pressure can vary continuously. Nevertheless, digital devices often record these quantities through samples collected at specific times.
Consequently, the underlying physical signal and its recorded representation may belong to different categories.
Databases and Analytics
A database might store a person’s height as a decimal measurement while recording the number of purchases as an integer. These variables require different interpretations because one represents a measured quantity and the other represents a count.
Similarly, analysts may use histograms to examine distributions and bar charts to display categories or distinct counts. However, the most appropriate chart depends on the data structure and analytical objective, not merely on whether a variable contains decimal places.
Software and Mathematical Models
Simulation software may represent continuous processes through numerical approximations. For example, a program modeling a moving object can update its position at discrete time steps while approximating continuous motion.
Therefore, distinguishing a modeled process from its digital representation prevents confusion in technical documentation and statistical analysis.
Etymology: Where Do Continuous and Discrete Come From?
The histories of both words help explain their present meanings.
Continuous comes through Latin continuus, meaning connected or uninterrupted. Its modern uses retain this central idea of something extending without a break. In mathematics, the term developed a more specialized meaning involving functions whose behavior lacks breaks over a specified domain.
Discrete comes from Latin discretus, associated with separating or distinguishing. It entered English with meanings related to distinctness and separation. Mathematics later adopted the term to describe separate values, particularly in contrast with continuous quantities.
Although their histories differ, both words describe how elements relate to one another. Continuous emphasizes connection, while discrete emphasizes distinction.
An Expert Perspective on Continuous and Discrete Data
A useful principle in statistics is to classify a variable according to what it represents rather than how its values happen to be displayed.
As a practical teaching guideline:
“Classify the quantity first, then choose the measurement method and statistical model that fit it.”
This is an explanatory principle rather than a quotation attributed to a particular researcher.
For example, rounding a person’s height to the nearest centimeter doesn’t automatically turn height into a discrete quantity in the underlying model. Conversely, writing a count as a decimal doesn’t make fractional people meaningful observations.
Therefore, the definition of the variable matters more than its visual formatting.
Two Practical Case Studies
The following illustrative case studies show how correct classification improves analysis. Their figures are hypothetical examples intended to demonstrate the reasoning process, not independently verified research findings.
Case Study 1: Monitoring Factory Temperature
A manufacturing facility wants to investigate why certain products fail quality checks. Its monitoring system records equipment temperature every minute.
Suppose the recorded temperatures include 72.1, 72.4, and 72.8 degrees. The team treats temperature as a continuous variable because intermediate values are meaningful within the selected measurement model.
The analysts compare temperature readings with the quality inspection results. They then investigate whether higher operating temperatures are associated with more defective products.
Result: The team can examine temperature variation as a measured quantity instead of incorrectly treating each possible temperature as a separate count category. This classification supports a more appropriate analysis of the relationship between operating conditions and product quality.
Case Study 2: Analyzing Online Store Orders
An online retailer wants to understand how many orders arrive each hour. Its reporting system records totals such as 18, 24, and 31 orders.
The analyst classifies the number of orders as discrete data because each order is a separate event. Although the reporting interval is one hour, the total number of orders cannot ordinarily include a fraction of an order.
The retailer can then compare order counts across hours, weekdays, and promotional periods.
Result: Correct classification allows the team to summarize order volumes as counts and select statistical methods suitable for count data. It also prevents the mistaken interpretation of fractional orders as actual events.
Error Prevention Checklist
Before classifying a variable or preparing a report, use the following checklist.
Always Use Continuous When
- Modeling a quantity that can take intermediate values across a range.
- Describing height, distance, elapsed time, or temperature under a continuous model.
- Discussing a signal that varies smoothly in the relevant representation.
- Explaining a continuous mathematical function over its specified domain.
- Referring to an ongoing process when the ordinary meaning is uninterrupted.
Never Use Discrete When
- You intend to describe a quantity as smoothly variable within a continuous model.
- The word would incorrectly imply that every intermediate value is impossible.
- You’re describing a continuously varying signal rather than its individual digital samples.
- You’re confusing continuous measurements with the separate times at which a device records them.
Always Use Discrete When
- Counting people, products, visits, or other individual events.
- Representing a variable that takes distinct, countable values.
- Describing separate states or individually distinguishable objects.
- Analyzing the number of errors, calls, orders, or arrivals.
Check Before Finalizing
First, define the variable. Next, determine its possible values. Finally, select the classification that matches the intended model.
This process is more reliable than deciding from the number of decimal places displayed in a spreadsheet.
Related Grammar and Conceptual Confusions You Should Master
Several related distinctions can improve mathematical writing and general communication.
- Accuracy vs precision: Accuracy concerns closeness to the true value, while precision concerns consistency or measurement resolution, depending on context.
- Parameter vs statistic: A parameter describes a population, whereas a statistic summarizes sample data.
- Population vs sample: A population is the full group of interest, while a sample is a subset used for analysis.
- Mean vs median: The mean is the arithmetic average, whereas the median is the middle value after sorting observations.
- Correlation vs causation: Correlation describes an association, while causation means one factor produces a change in another.
- Qualitative vs quantitative: Qualitative data describe categories or qualities, whereas quantitative data represent numerical amounts or counts.
- Nominal vs ordinal: Nominal categories have no inherent order, while ordinal categories have a meaningful ranking.
- Parameter vs variable: A parameter is a fixed quantity within a specified model, while a variable can take different values.
- Sample size vs sampling interval: Sample size is the number of observations, whereas sampling interval is the spacing between observations or collection times.
- Probability density vs probability mass: Density functions describe continuous random variables, whereas mass functions assign probabilities to discrete outcomes.
Understanding these concepts makes it easier to interpret datasets, choose suitable analytical techniques, and explain results clearly.
Frequently Asked Questions
1. What is the difference between continuous and discrete data?
Continuous data represent quantities that can take intermediate values within a range, while discrete data consist of distinct, countable values. For example, height is commonly modeled as continuous, whereas the number of students in a class is discrete.
2. Is height continuous or discrete?
Height is generally treated as a continuous variable because it can take many possible values within a range. Although measurement devices round height to a particular precision, that limitation doesn’t necessarily change the underlying model.
3. Is the number of students continuous or discrete?
The number of students is discrete because students are counted individually. A classroom can contain 20 or 21 students, but it cannot ordinarily contain 20.5 students as a count of enrolled individuals.
4. What is the difference between continuous and discrete variables in statistics?
A continuous variable can take any value within a specified interval under its model, whereas a discrete variable takes values from a finite or countably infinite set. This distinction influences probability distributions, statistical calculations, and visualization choices.
5. Is time continuous or discrete?
Time is commonly modeled as continuous because it can vary smoothly and can be measured to increasingly fine precision. However, a digital clock may display discrete readings, and a computer simulation may update time in separate steps.
6. Is temperature continuous or discrete?
Temperature is commonly modeled as continuous because intermediate values are meaningful. Nevertheless, a thermometer or software application may round measurements or record them at fixed intervals, creating a discrete set of recorded observations.
7. What are examples of discrete and continuous data?
Examples of continuous data include height, distance, elapsed time, and temperature. Examples of discrete data include the number of customers, books, orders, and website visits. The key distinction is whether the variable represents a measured quantity or a count.
8. Can continuous data be converted into discrete data?
Yes. Continuous measurements can be grouped into intervals or rounded to selected values. For example, exact heights can be grouped into centimeter categories. However, this changes the representation of the data and may reduce information about individual measurements.
9. Why is the difference between continuous and discrete data important?
The distinction matters because it affects how information is measured, summarized, visualized, and modeled. Misclassifying a variable can lead to unsuitable statistical methods, inaccurate assumptions, or misleading conclusions.
Conclusion:
Choosing between continuous and discrete depends on the type of quantity you’re describing. Continuous refers to values that can vary smoothly within a range, while discrete describes separate, distinguishable values that can be counted.
For example, height, temperature, and elapsed time are commonly modeled as continuous quantities. By comparison, the number of employees, customer visits, or products sold represents discrete data.
Nevertheless, context matters. A digital device may record continuous physical measurements at separate time intervals, and rounding can make a continuous quantity appear discrete. Therefore, always distinguish the underlying variable from the way it’s measured or stored.
Ultimately, defining the quantity before selecting its classification is the most reliable way to avoid mistakes in mathematics, statistics, science, and technology.